Investor Relations
Profitability
in Every Return

Quarterly Results
| FINANCIAL REPORT | 2025 | 2024 | 2023 | 2022 | 2021 | 2020 |
|---|---|---|---|---|---|---|
| 1st Quarterly | DOWNLOAD 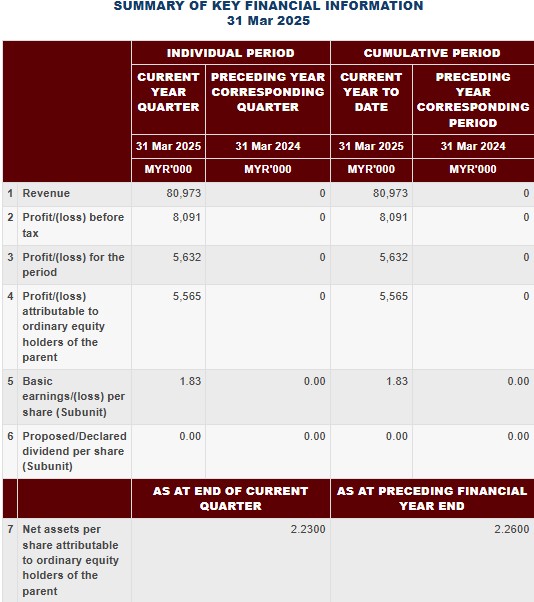 |
DOWNLOAD  |
DOWNLOAD  |
DOWNLOAD 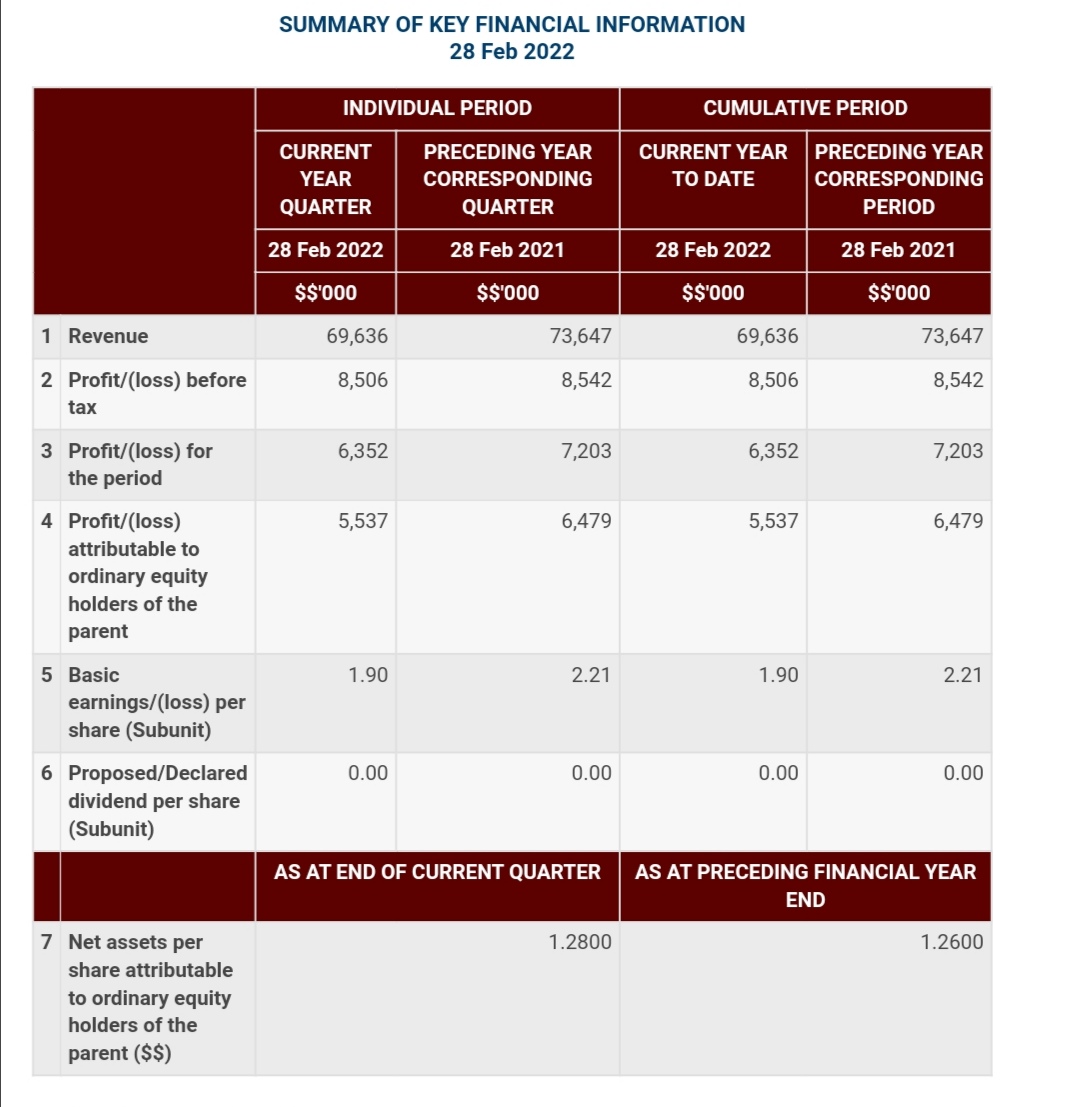 |
DOWNLOAD 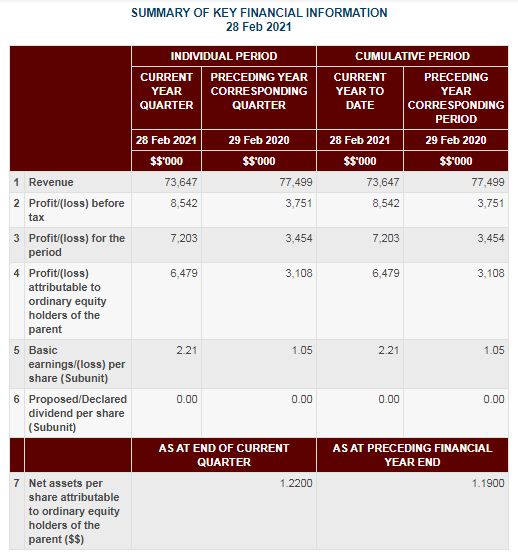 |
DOWNLOAD 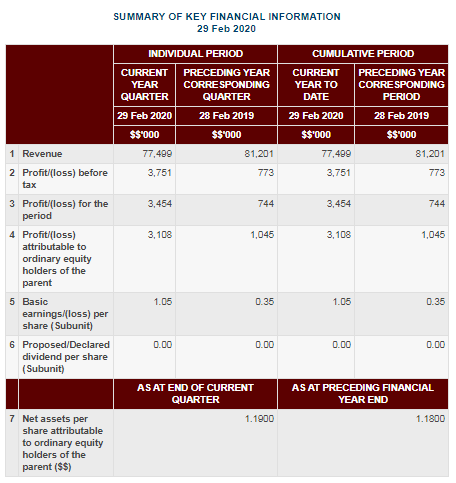 |
| 2nd Quarterly | DOWNLOAD  |
DOWNLOAD |
DOWNLOAD  |
DOWNLOAD 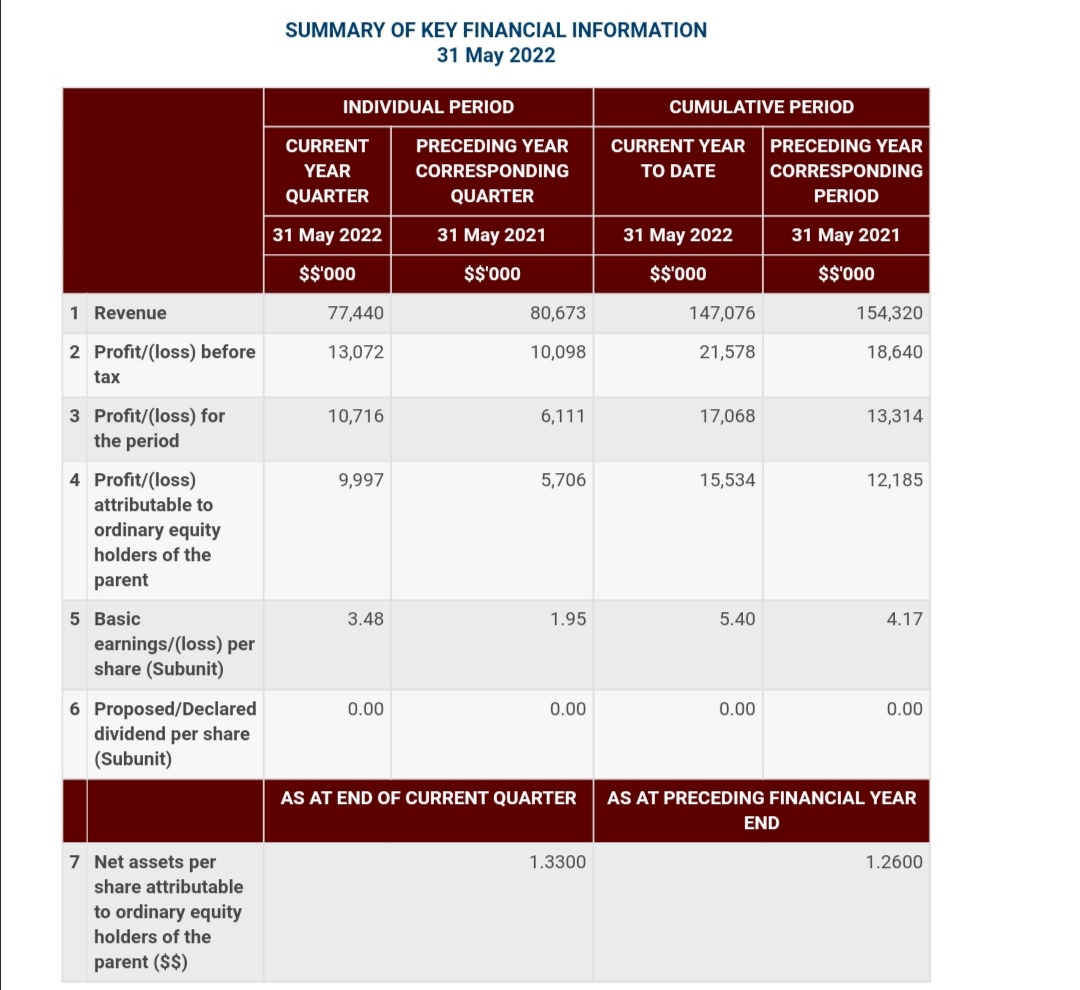 |
DOWNLOAD 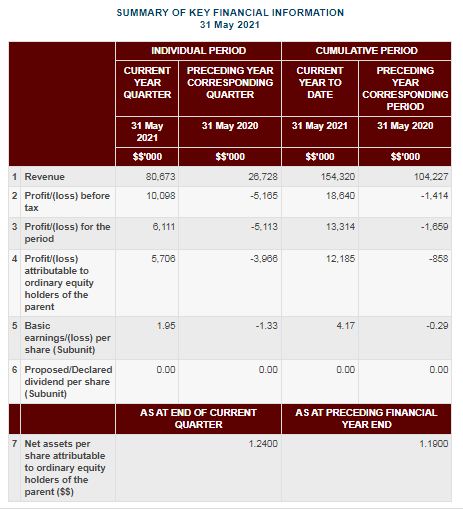 |
DOWNLOAD 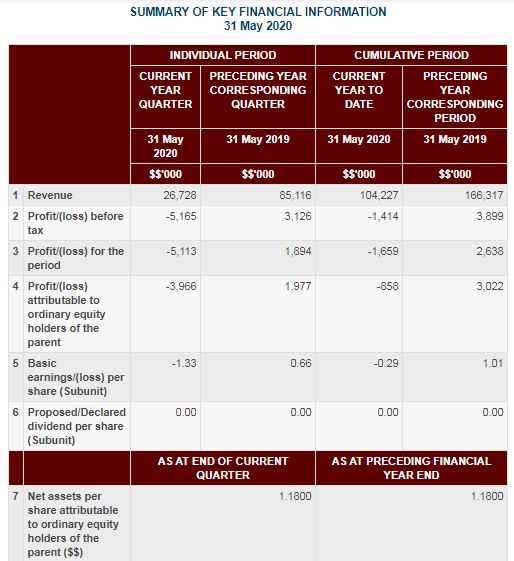 |
| 3rd Quarterly | DOWNLOAD |
DOWNLOAD |
DOWNLOAD | DOWNLOAD |
DOWNLOAD  |
DOWNLOAD 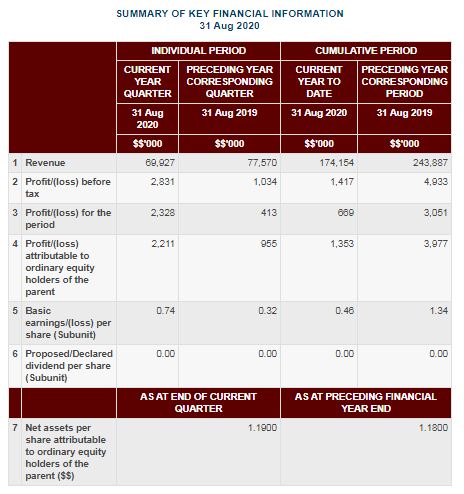 |
| 4th Quarterly | |
DOWNLOAD |
DOWNLOAD | DOWNLOAD | DOWNLOAD | DOWNLOAD 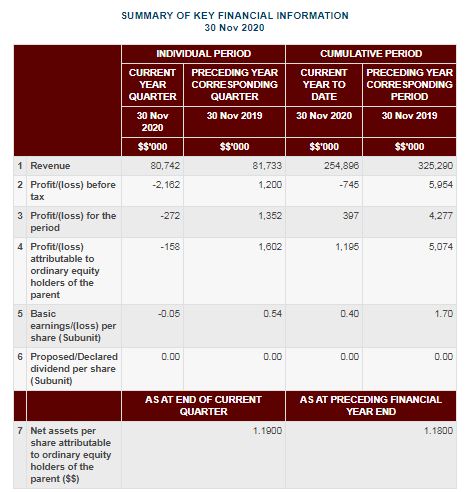 |
| Period Ended December | DOWNLOAD |
|
5 YEARS FINANCIAL RESULTS
| FINANCIAL HIGHLIGHTS |
2024 |
RESTATED
2023 |
RESTATED
2022 |
2021 |
2020 |
|---|---|---|---|---|---|
| Revenue | 381,428 | 304,812 | 294,049 | 268,509 | 254,896 |
| (Loss)/Profit Before Tax | 72,388 | 59,960 | 36,616 | 25,381 | (745) |
| Profit After Tax | 63,441 | 56,691 | 30,927 | 19,283 | 397 |
| Net Profit Attributable to Equity Holders | 62,574 | 56,263 | 29,368 | 17,510 | 1,194 |
| Total Assets | 770,465 | 580,576 | 499,173 | 490,148 | 465,699 |
| Total Borrowings | 15,523 | 4,392 | 12,133 | 834 | 4,219 |
| Net Assets | 683,724 | 509,235 | 438,129 | 418,395 | 407,314 |
| FINANCIAL INDICATORS |
2024 |
RESTATED
2023 |
RESTATED
2022 |
2021 |
2020 |
|---|---|---|---|---|---|
| Return on Equity (%) | 9 | 12 | 8 | 5 | 0.11 |
| Return on Total Assets (%) | 9 | 10 | 7 | 5 | -0.13 |
| Gearing Ratio (%) | Net Cash | Net Cash | Net Cash | Net Cash | Net Cash |
| Earnings per Share (sen) | 21 | 19 | 10 | 6 | 0.40 |
| Net Assets per Share (RM) | 2.26 | 1.65 | 1.42 | 1.26 | 1.19 |
| Price Earning Ratio | 7 | 8 | 17 | 15 | 117 |
| Share Price as at the Financial Year End (RM) | 1.42 | 1.54 | 1.75 | 0.92 | 0.47 |